- Dataneb Team

- May 30, 2018
- 3 min read
Updated: Dec 1, 2022
Refer to my previous blogs (Linux | Mac users) to install the ELK stack on your machine. Once installation is done, there are couple of ways to load CSV files into Elasticsearch which I am aware of (one via Logstash and another with filebeat). In this blog, we will be using Logstash to load the file.
I am using sample Squid access logs (comma-separated CSV file) in order to explain this blog. You can find the file format details at this link.
Sample Data
Copy and paste these records to create an access_log.csv file. I randomly selected this format because it's a CSV file which is a widely used format in the production environment and we have various types of attributes (data types) in the file.
$ more /Volumes/MYLAB/testdata/access_log.csv Time,Duration,Client_address,Result_code,Bytes,Request_method,Requested_URL,User,Hierarchy_code,Type 1121587707.473,60439,219.138.188.61,TCP_MISS/503,0,CONNECT,203.84.194.44:25,-,DIRECT/203.84.194.44,- 1121587709.448,61427,219.138.188.61,TCP_MISS/503,0,CONNECT,203.84.194.50:25,-,DIRECT/203.84.194.50,- 1121587709.448,61276,219.138.188.61,TCP_MISS/503,0,CONNECT,67.28.114.36:25,-,DIRECT/67.28.114.36,- 1121587709.449,60148,219.138.188.61,TCP_MISS/503,0,CONNECT,4.79.181.12:25,-,DIRECT/4.79.181.12,- 1121587710.889,60778,219.138.188.61,TCP_MISS/503,0,CONNECT,203.84.194.39:25,-,DIRECT/203.84.194.39,- 1121587714.803,60248,219.138.188.61,TCP_MISS/503,0,CONNECT,203.84.194.50:25,-,DIRECT/203.84.194.50,- 1121587714.803,59866,219.138.188.61,TCP_MISS/503,0,CONNECT,203.84.194.43:25,-,DIRECT/203.84.194.43,- 1121587719.834,60068,219.138.188.61,TCP_MISS/503,0,CONNECT,203.84.194.45:25,-,DIRECT/203.84.194.45,- 1121587728.564,59642,219.138.188.55,TCP_MISS/503,0,CONNECT,168.95.5.45:25,-,DIRECT/168.95.5.45,-
My file looks something like this,

Start Elastics
Now start Elasticsearch and Kibana (if you don't remember how to start them, refer to my previous blogs Linux | Mac users). Don't kill these processes, both are required by logstash to load the data.
$ elasticsearch

$ kibana

Logstash Configuration
In order to read the CSV files with Logstash, you need to create a configuration file that will have all the configuration details for accessing the log file like input, filter & output.
In short,
The input tag contains details like filename, location, start position, etc.
Filter tag contains file type, separator, column details, transformations, etc.
Output tag contains host detail where the file will be written, index name (should be in lower case), document type, etc.
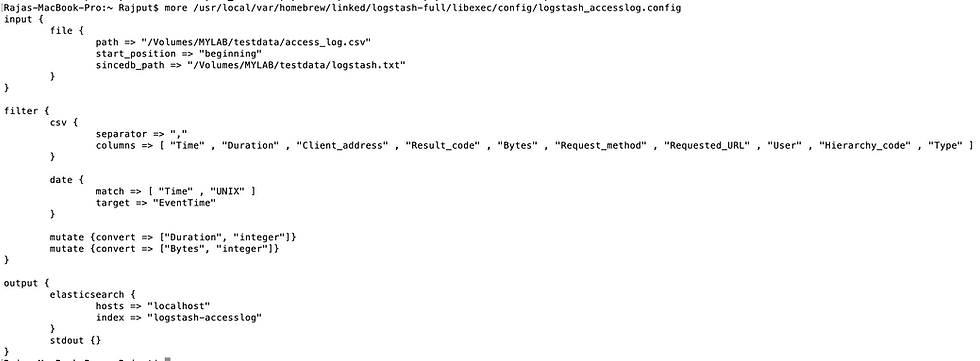
These tags look like JSON but actually, these are not JSON. You can say these formats are specific to Logstash. I have created a config file under the config directory in logstash as shown below.
$ more /usr/local/var/homebrew/linked/logstash-full/libexec/config/logstash_accesslog.config
input {
file {
path => "/Volumes/MYLAB/testdata/access_log.csv"
start_position => "beginning"
sincedb_path => "/Volumes/MYLAB/testdata/logstash.txt"
}
}
filter {
csv {
separator => ","
columns => [ "Time" , "Duration" , "Client_address" , "Result_code" , "Bytes" , "Request_method" , "Requested_URL" , "User" , "Hierarchy_code" , "Type" ]
}
date {
match => [ "Time" , "UNIX" ]
target => "EventTime"
}
mutate {convert => ["Duration", "integer"]}
mutate {convert => ["Bytes", "integer"]}
}
output {
elasticsearch {
hosts => "localhost"
index => "logstash-accesslog"
}
stdout {}
}
Explanation!
These are very basic tags and straightforward.
You use the columns tag to define the list of fields within quotes (if you face issues use single quotes instead).
"mutate" is basically doing minor datatype conversion.
Also, "match" is used to convert the UNIX timestamps to human-readable time format.
Further, a logstash-access log is the index name that I am using for Squid access logs.
Still, if there is any question regarding any of the tags please comment (in the comment section below) and I will get back to you as soon as possible.
Also, you can change sincedb_path to /dev/null if you don't want to keep the track of loaded files.
If you want to reload the same file again make sure you delete the entry from the sincedb_path file (logstash.txt in this case).
Here is my config file snapshot, zoom it a little bit to see the content :)
Run Logstash & Load data
You are all set to start Logstash now with the configuration file which we just created. Follow the below steps in order to run Logstash with the config file. It will take a few seconds to index all the records.
Change your logstash home location accordingly, mine is homebrew as I am using Mac.
$ /usr/local/var/homebrew/linked/logstash-full/bin/logstash -f /usr/local/var/homebrew/linked/logstash-full/libexec/config/logstash_accesslog.config

Make sure you are not getting any Error while loading the file in logstash output, otherwise the file will not load and there will be no index creation.
Now open Kibana and run the below command in the "Dev Tools" tab in order to see how many records got loaded. I loaded 10 records just for demonstration

Kibana Index Creation
Now go to the "Management" tab in Kibana and click on Index Patterns => Create Index Pattern.
Create an Index pattern with the same name which we mentioned in the configuration file logstash-accesslog.
Hit "Next step" and select time filter => I don't want to use time filter. Now hit "Create index pattern".

Now go to the "Discover" tab and you will be able to view the indexed data which we just loaded.

Kibana Dashboard
I don't have much data to create a Kibana dashboard here, but just for demonstration purposes, let's say you want to see the number of events that occurred/milliseconds. It's an impractical example, as you will never have a such a use case.
Go to the "Visualize" tab and hit Create new. Select a pie chart for example,

Now select logstash-accesslog index and apply changes in buckets as highlighted below,

That's all, you can see a number of events that occurred each millisecond.
If you have any questions please write in the comments section below. Thank you.
_edited_edited.png)

Hi Atiqah, you need to create separate configuration for each csv file, with separate input, filter and output fields based on their column names. Basically, if you have 10 different CSV files - you will have 10 config files and each will have their own column definitions.
Hi Hina, thank you for your sharing about how to load CSV file into the elasticsearch. Here I have a question, how to load multiple CSV files with different column names and data?
Very helpful post for creating kibana dashboard ....
Aug/2019- Updated with new ELK version.
Here are the links for dashboard sample -
1. Kibana dashboard example - https://www.dataneb.com/blog/kibana-dashboard-example
2. Kibana GeoIP example - How to index geographical location of IP addresses to Elasticsearch - https://www.dataneb.com/blog/kibana-geoip-example-how-to-index-geographical-location-of-ip-addresses-to-elasticsearch